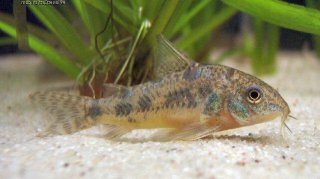
Conte, M., de Campos, D. F., & Eme, J. (2023). Effective practices for thermal tolerance polygon experiments using mottled catfish Corydoras paleatus. Journal of Thermal Biology, 103616.
https://doi.org/10.1016/j.jtherbio.2023.103616
https://www.sciencedirect.com/science/a ... 523001572/
Keywords: Acclimation, Cessation of eating, Climate change, Critical thermal tolerance, Fish, Physiology, South America, TemperatureHighlightsAbstract
- This study provides researchers with guidelines to determine fish species' thermal niches.
- are eurythermal and were acclimated for ∼2 weeks between 7. → 32 °C.
- Slopes of tolerance gained through thermal acclimation at 3, 4, 5 or 6 acclimation temperatures were statistically similar.
- We demonstrate that 3 acclimation temperatures spread out across a species' thermal range are sufficient to create a full thermal tolerance polygon.
Temperature is an important environmental factor that affects how organisms allocate metabolic resources to physiological processes. Laboratory experiments that determine absolute thermal limits for representative species are important for understanding how fishes are affected by climate change. Critical Thermal Methodology (CTM) and Chronic Lethal Methodology (CLM) experiments were utilized to construct a complete thermal tolerance polygon for the South American fish species, Mottled catfish (). Mottled catfish showed Chronic Lethal Maximums (CLMax) of 34.9 ± 0.52 °C and Chronic Lethal Minimums (CLMin) of 3.8 ± 0.08 °C. Fish were chronically acclimated (∼2 weeks) to 6 temperatures ranging from 7.2 ± 0.05 °C →32.2 ± 0.16 °C (7 °C, 12 °C, 17 °C, 22 °C, 27 °C, and 32 °C), and CTM used to estimate upper and lower acute temperature tolerance. Linear regressions of Critical Thermal Maximum (CTMax) and Minimum (CTMin) data with each acclimation temperature were used along with CLMax and CLMin to create a complete thermal tolerance polygon. The highest CTMax was 38.4 ± 0.60 °C for fish acclimated to 32.2 ± 0.16 °C, and the lowest CTMin was 3.36 ± 1.84 °C for fish acclimated to 7.2 ± 0.05 °C. Mottled catfish have a polygon measuring 785.7°C2, and the slope of the linear regressions showed the species gained 0.55 °C and 0.32 °C of upper and lower tolerance per degree of acclimation temperature, respectively. We compared slopes of CTMax or CTMin regression lines to each other using a set of comparisons between 3, 4, 5, or 6 acclimation temperatures. Our data demonstrated that 3 acclimation temperatures were as sufficient as 4 → 6 to pair with estimates of chronic upper and lower thermal limits for accurately determining a complete thermal tolerance polygon. Construction of this species' complete thermal tolerance polygon provides a template for other researchers. The following is sufficient to generate a complete thermal tolerance polygon: Three chronic acclimation temperatures that are spread somewhat evenly across a species’ thermal range, include an estimation of CLMax and CLMin, and are followed by CTMax and CTMin measurements.